STOQ Terminal. No more spreadsheets to judge a stock
A research tool that puts a stock's figures, valuation and risk on one screen, for self-directed investors.
Working out a stock properly meant juggling separate spreadsheets and tools. The figures sat in one file, the valuation in another, and whether a stock was cheap stayed a gut feeling.
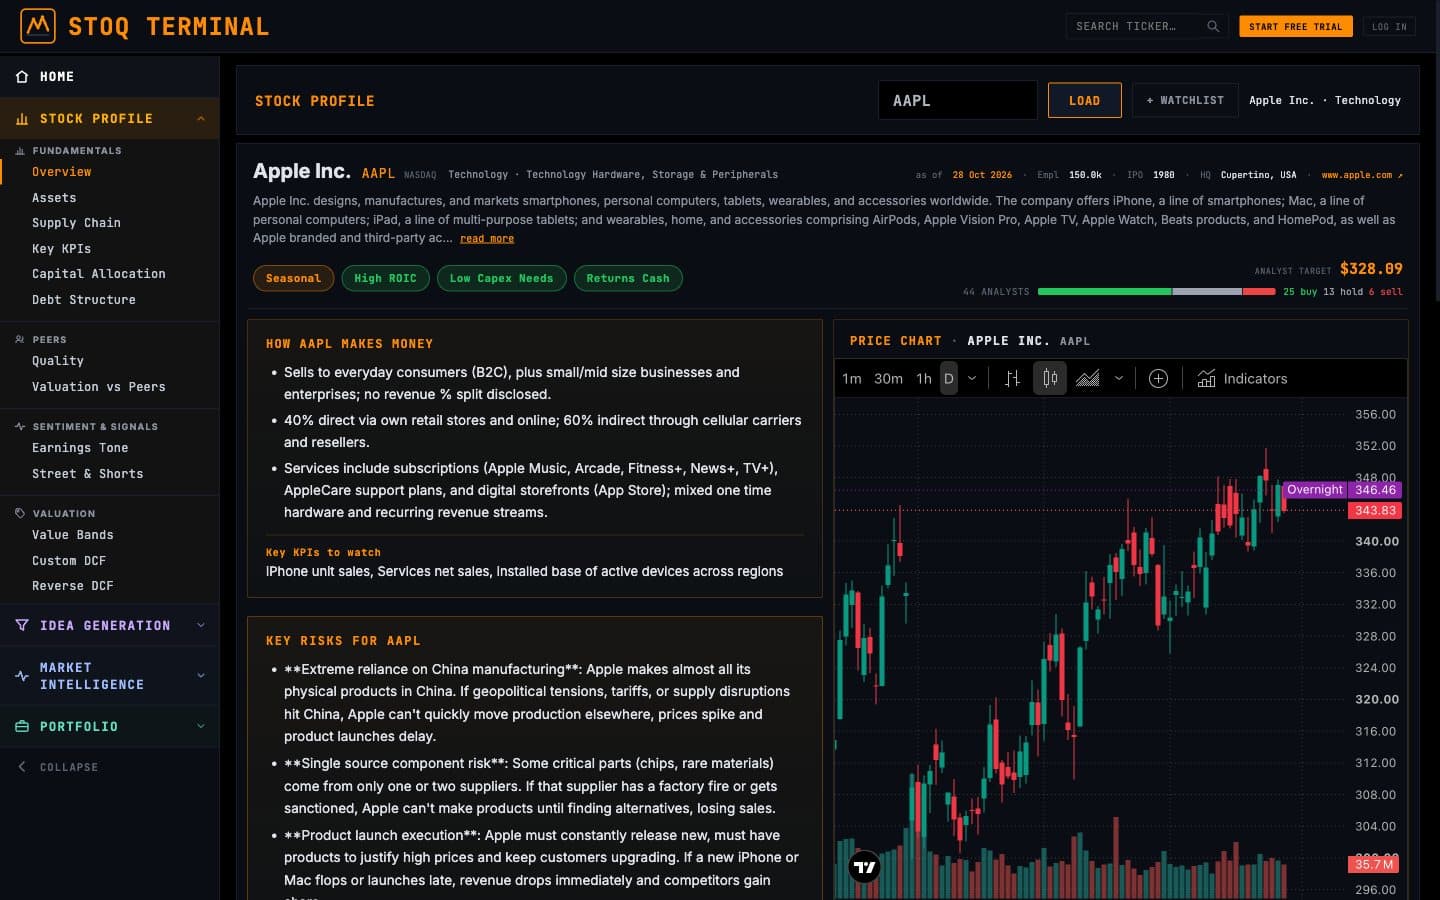
Result and build time
- Result
All the data to judge a company, brought together on one screen.
- Build time
2 months
Before and after
Before
- “My figures are in one spreadsheet, the valuation in another.”
- “Is this stock cheap? Mostly I go on gut feeling.”
- “Really getting to know one company takes me hours.”
Now
- Figures, valuation and risk sit together on one screen, per company.
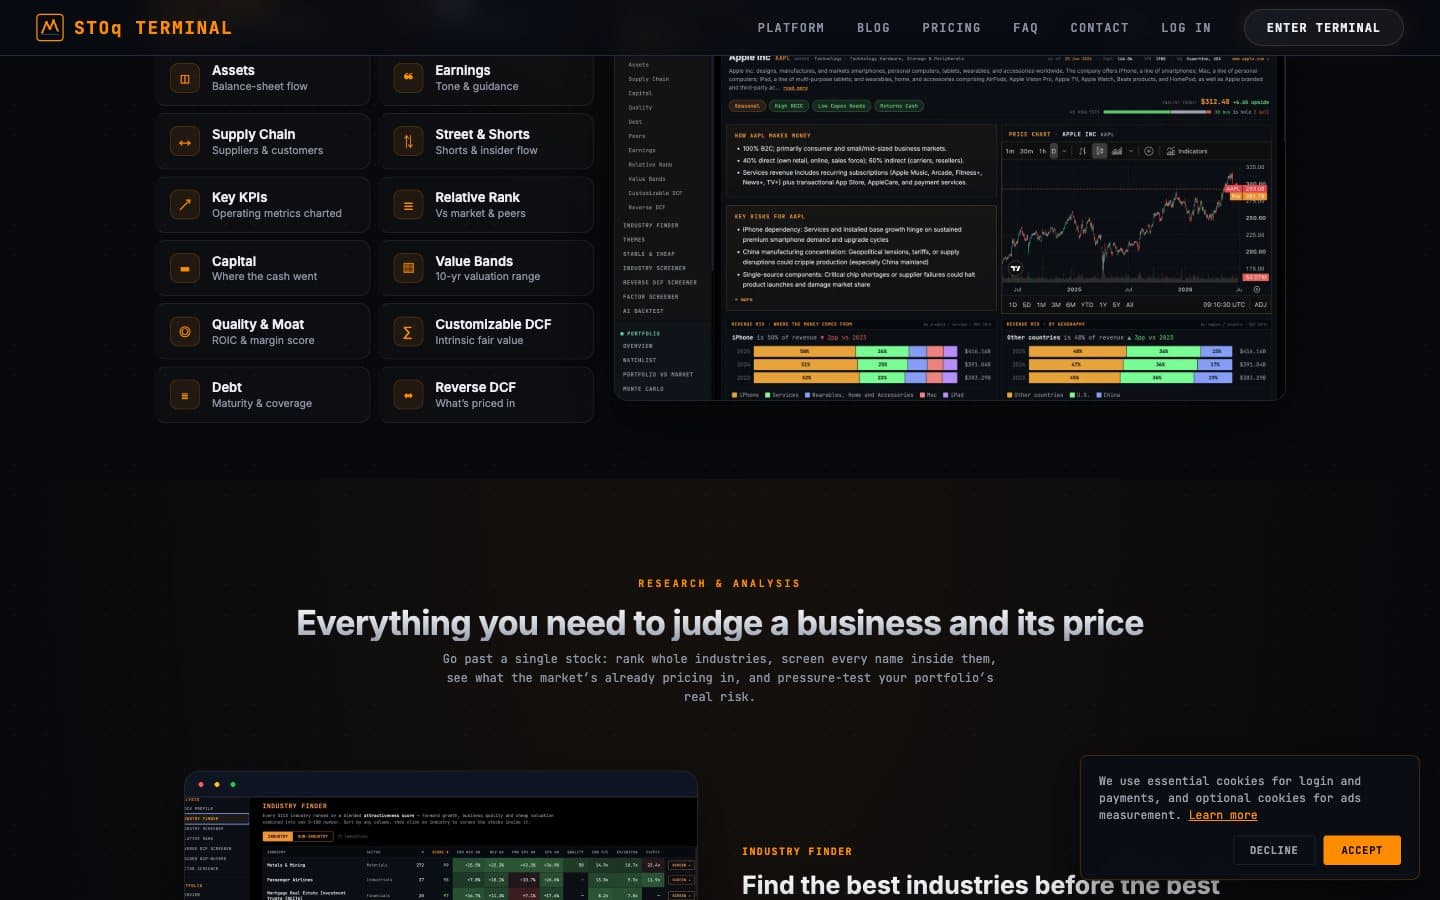
- You see the stock next to similar companies, and what growth is already in the price.
- You read in short text how the company makes money and what its biggest risks are.
What it looks like
How it works
You look up a company
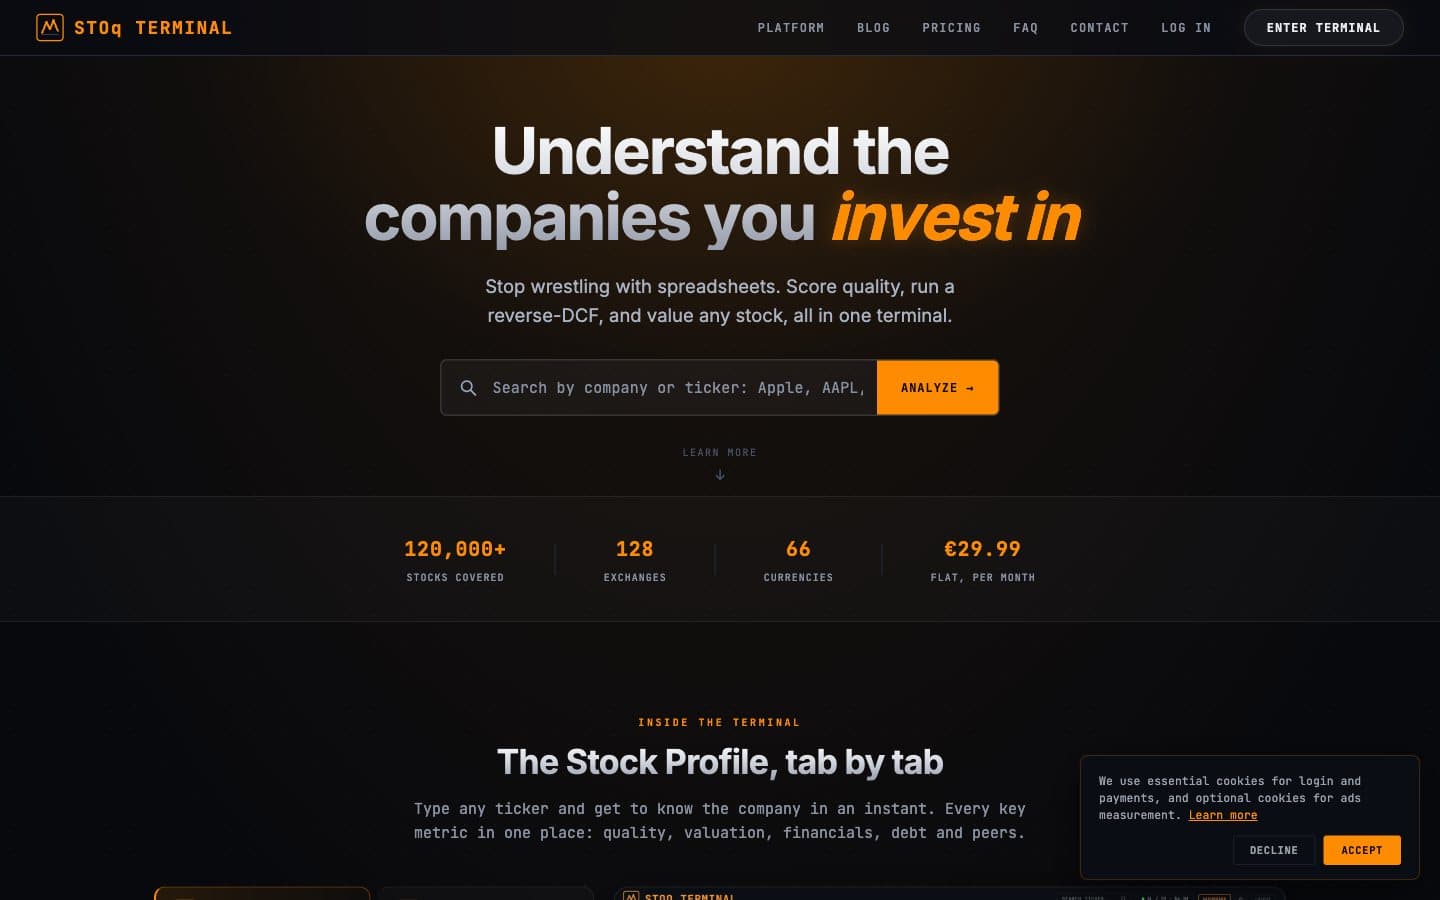
You type a company's name. You can choose from more than 120,000 stocks on 128 exchanges.
STOQ lines it all up
You read how the company makes money and what its biggest risks are, with a price chart next to it. Tabs show the figures, the debt, the valuation and the comparison with other companies.
You see what it does to your portfolio
You see what a stock does to the risk of your portfolio and run stress tests over it, such as rising interest rates.
What this proves
Bring complex data together.
A builder with the quote, the schedule and the purchasing in three files, or an agency that goes through five lists per client: it is the same puzzle, a lot of data in too many places. We built this for investors: all the data to judge a company, brought together on one screen, for more than 120,000 stocks.
Next case
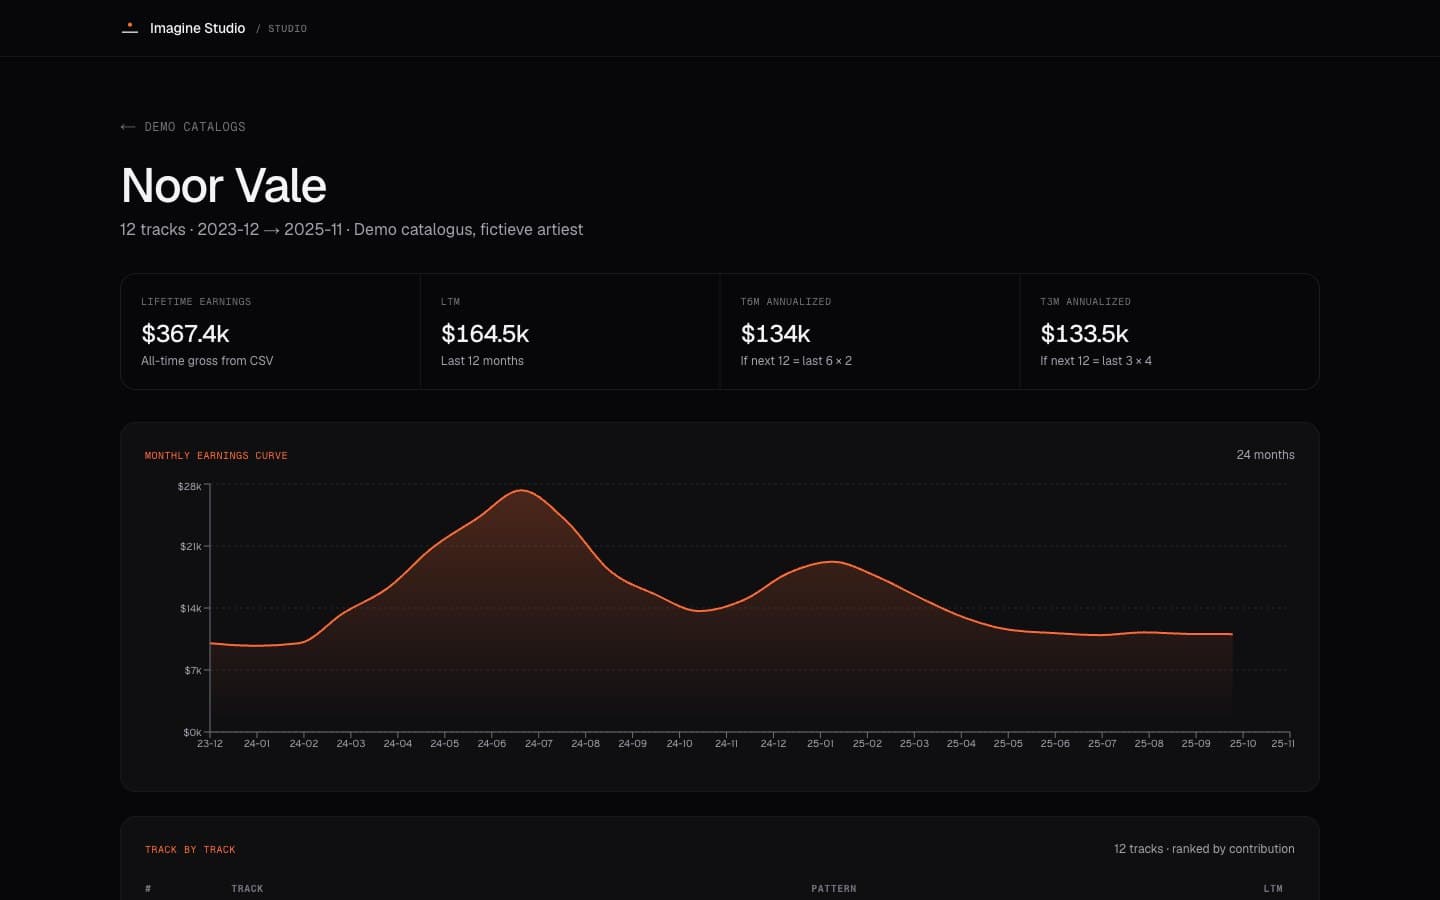
Does your team juggle loose spreadsheets too?
If the knowledge in your business is spread over files and tools, it can often fit on one screen. Tell us what you are juggling.